 Facebook
 Twitter
 Pinterest
 Copy Link


Hello there and welcome to the latest episode of Mondays with Matthew. I’m Windermere Real Estate’s Chief Economist, Matthew Gardner.
Today we are going to focus on last Thursday’s data release for US existing home sales activity in October, so let’s get straight to it.
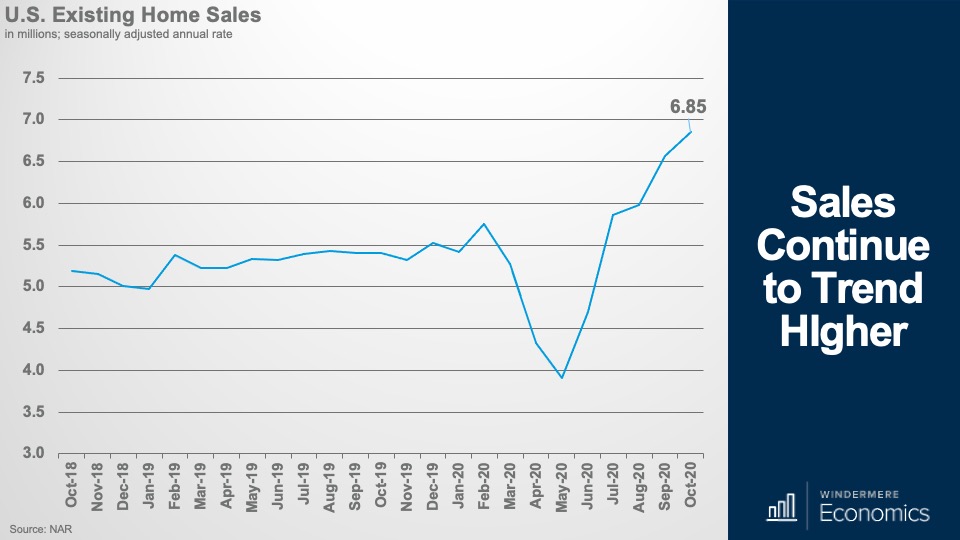
Well, if anyone out there was still thinking that the market was set to slow, they will have to wait a little longer. Existing home sales rose for the 5th consecutive month to an annual rate of 6.85 million units – and that’s up 4.3% from September and sales were 26.6% higher than we saw a year ago.
And it’s not just the annual rate that rose, as monthly sales came in at 573 thousand – and that’s the highest monthly figure since the market “snapped back’ in July following the initial COVID-19 shutdown.
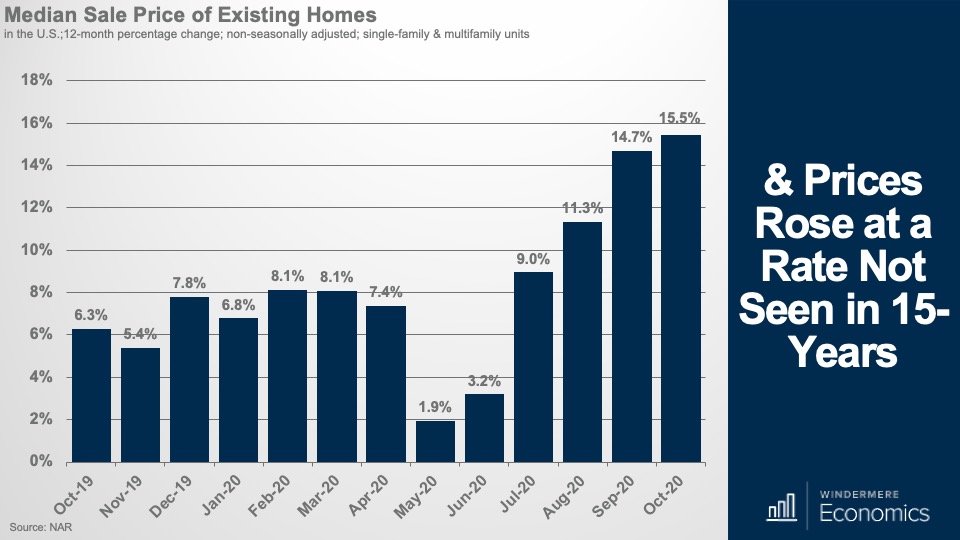
And with sales rising, so did prices, with the median price in October measured at $313,000 and that’s up by a massive 15.5% from a year ago and we haven’t seen that pace of price growth since 2006 and it was also the 104th straight month of year-over-year price gains.
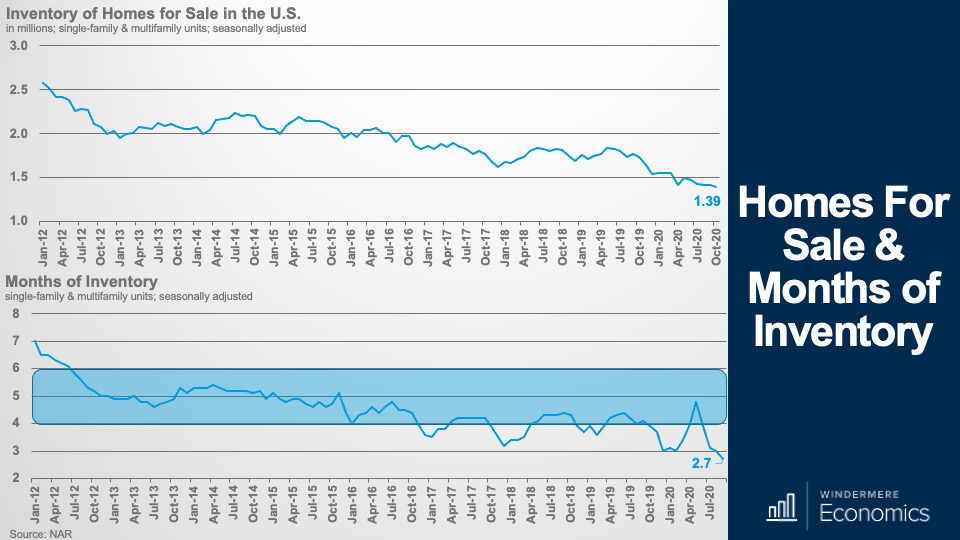
And we are seeing these significant increases in prices not just because mortgage rates are low – although that certainly isn’t hurting – but the bigger reason is that there’s far more demand than there is supply and, if you remember your college economics classes, what happens to prices when you have limited supply but net new demand? That’s right, they rise.
And as you can see here, there were fewer than 1.4 million homes for sale in October – now, I must add that I seasonally adjust my numbers and NAR doesn’t, but even if you use their figures there were just over 1.4 million homes for sale last month so it’s not much better.
And with tight supply and new demand, their is only 2.7 months of inventory at the current sales pace – and that’s an all-time low.
A balanced market – depending on where in the country you are, is between 4 and 6 months so we are a long way from balance.
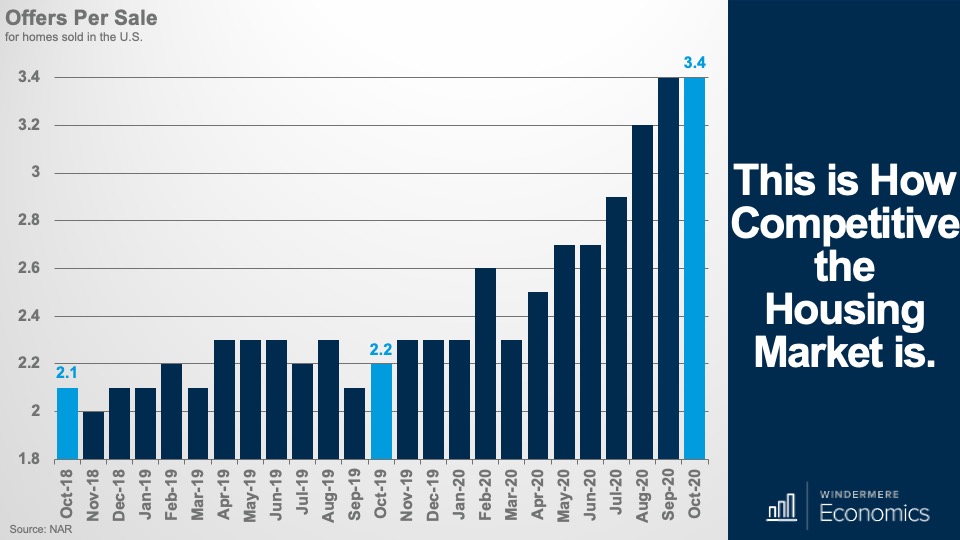
And to give you a different way to see how competitive the market is, there were an average of almost three and a half offers for every deal that was written last month. Additionally, 7 out of 10 homes sold within four weeks and the median market time coming in at just 21 days – it was 36 days a year ago.
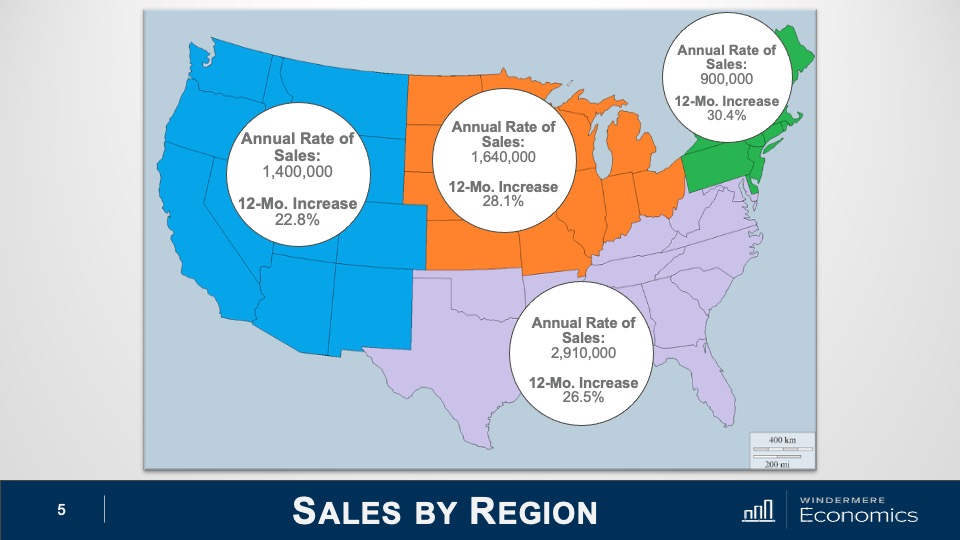
Regionally, sales rose the fastest in the small Northeast region, but all areas saw sales up by over 20 percent.
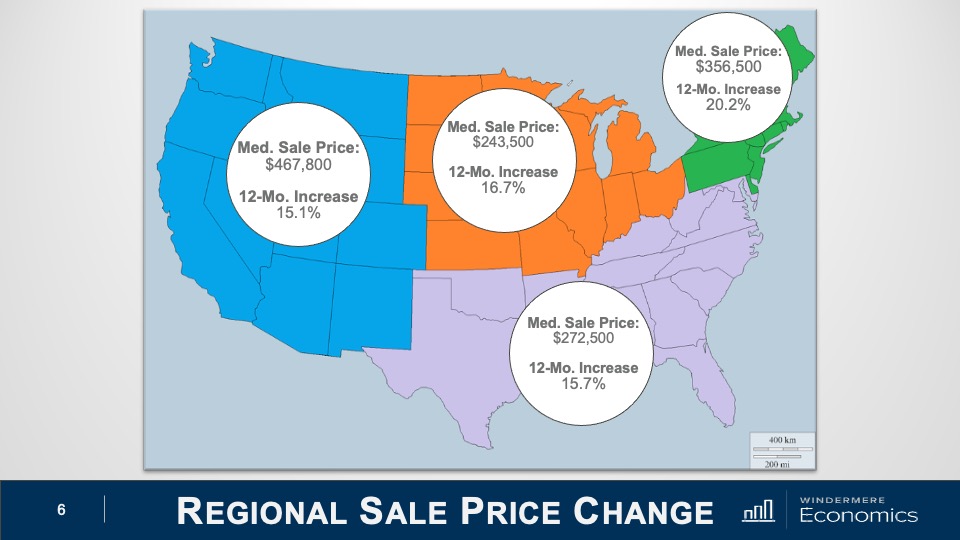
And when we look at sale prices, again, very significant increases across the board. I would note that the Northeast saw the greatest price increases for single-family homes – up 21.7% and condo prices rose the most in the Southern states where prices were up by 13.9% year over year.
Well, that’s the big picture, but you know me, I do love to dig into the dark corners of these data releases and, when I did, I found some pretty interesting nuggets there too.
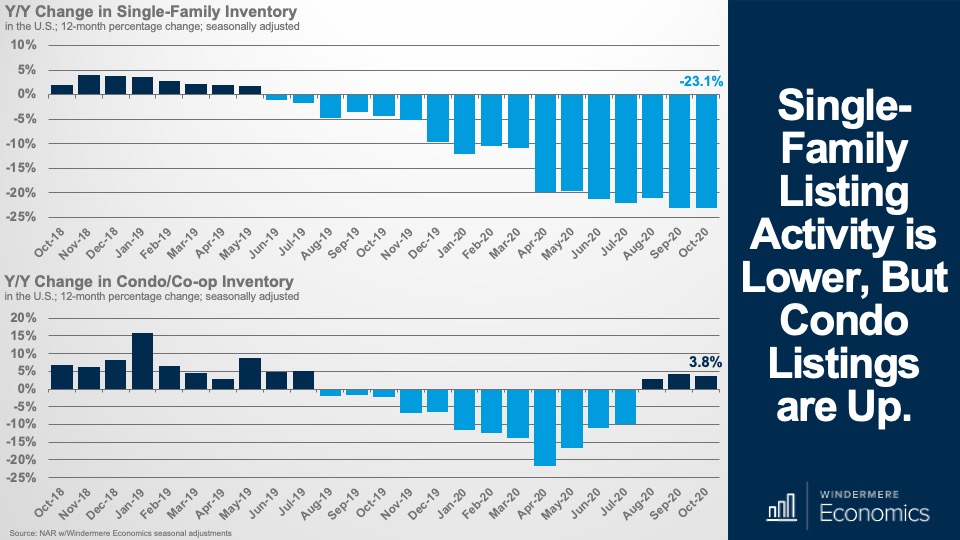
I mentioned single-family and multifamily price growth a moment ago, and when we break out the data, the supply numbers were interesting. Here is the year over year change in available inventory and its not surprising to see the number of single-family homes for sale way down but look at condos. Inventory is higher than it was a year ago.
Now, I think it’s too early to suggest that this is wholly due to COVID-19 and families flocking way from our urban centers, but I will be watching to see if this is an anomaly, or the start of a trend.
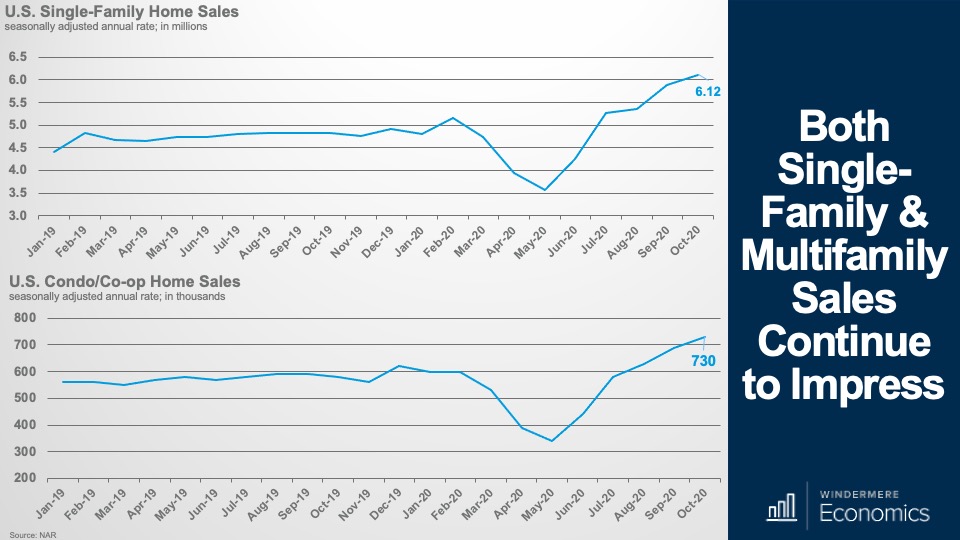
And my first reason for not being overly concerned about the condo market is this. Sales are still rising – up by 5.8% versus September and up by 25.9% year over year – even in the face of increasing inventory.
And single-family sales were up by just a little more – 26.7% year over year, but the month over month pace of single-family sales was actually lower than condos and came in 4.1% higher than in September.
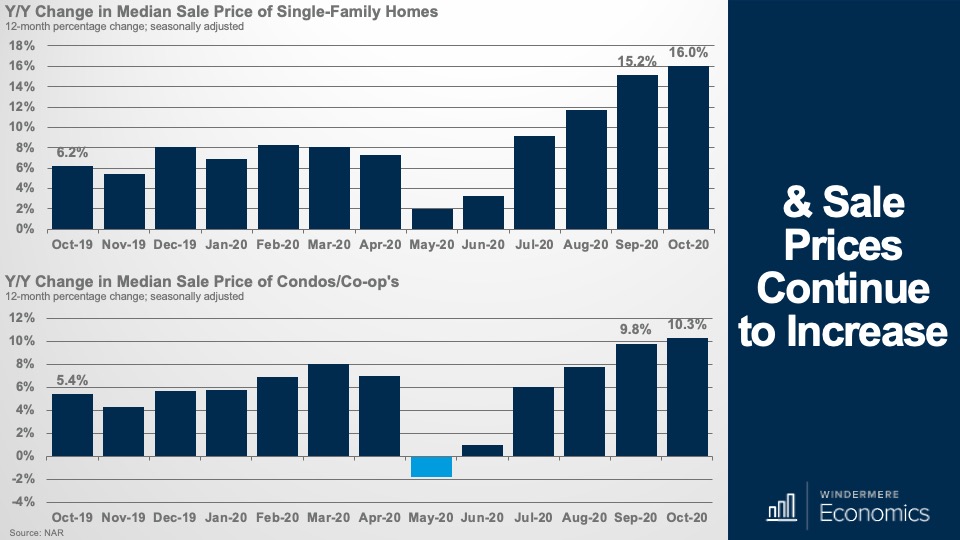
And finally, condo prices are still trending higher after turning negative at the outset of COVID-19 – up 10.3% year over year to $273,600. Not quite the pace of price growth seen in the single-family world where the median sale prices were up by 16% to $317,700, but not bad at all.
So, there you have it and I think you’ll agree, these were pretty impressive numbers across the board. Certainly, no sign of a slowdown but, as I suggested earlier, I will be watching the multifamily market to see if inventory levels continue to rise and, if they do, we may see price growth starting to slow even if the single family market continues its upward trajectory.
But, again, I must reinforce my view that this pace of price growth is absolutely not sustainable. Of course, very favorable mortgage rates are still in place. In fact, the 30-year hit another all-time record low last week at 2.72%, but I still believe that we are close to the lows that will be seen in this cycle –we’re just not there yet.
Housing continues to outperform with first time buyers still out in force (32% of all sales went to them) and demand for second homes appears solid too – they accounted for 14% of all sales – a figure that matches October 2019 so no visible signs of COVID-19 stress there either.
The bottom line is that something has to give. I am not saying that prices will retreat, rather the pace of growth has to slow even with very significant demand, and it will happen because of one of two reasons or maybe a combination of both.
Either we will hit an affordability ceiling, which will slow the price increases that we are experiencing OR we will see additional supply which will temper prices.
You see, although I find it highly unlikely we will see a significant increase in the number of resale homes coming to market, I do see builders stepping up and developing more homes.
You see, builders are getting bullish – and we know this from the National Association of Homebuilders Market Index which hit another all-time high earlier this month and I believe that this optimism will lead single-family starts to stay well above 1 million units next year and rising even more after that, which will be a relief to some buyers who remain very frustrated by the limited inventory available.
But I am getting ahead of myself.
You see, in 2 weeks’ time I will be sharing my 2021 US housing forecast with you all so I really shouldn’t give too much away right now.
The housing market is still performing – COVID or no COVID – and this will continue as we close out the year even if we see some States slowing their economies as new coronavirus rates spike.
As always, if you’ve got any questions about my comments today, I’d love to hear from you but in the meantime, take care out there, and I hope that you will join me again in 2 weeks when I will be revealing my US housing market forecast for 2021.
Bye now.
